On this page
Tracing and OpenTelemetry
Deno provides an experimental high-performance implementation of OpenTelemetry
(What is OpenTelemetry?). You can use the official @opentelemetry
packages in combination with Deno's @deno/otel package to automatically export
telemetry from your application.
To activate OpenTelemetry, at least two environment variables are needed:
OTEL_EXPORTER_OTLP_ENDPOINT: The URL to which spans, metrics, and logs will be sent. The default ishttp://localhost:4318and any scheme, host, port, and path provided will override that section of the default URL.OTEL_EXPORTER_OTLP_PROTOCOL: Currently this may be one ofhttp/protobuforhttp/json.
The OpenTelemetry specification provides a full list of environment variables: https://opentelemetry.io/docs/specs/otel/configuration/sdk-environment-variables/.
As this API is currently unstable, Deno must also be run with the
--unstable-otel flag.
A Quick Example Jump to heading
Grafana provides a useful docker container to test out OpenTelemetry: https://github.com/grafana/docker-otel-lgtm. Let's connect a simple Deno application to this.
import { trace } from "npm:@opentelemetry/api";
import "jsr:@deno/otel/register";

const tracer = trace.getTracer("my-app");

Deno.serve(async (request) => {
  return await tracer.startActiveSpan("request", async (span) => {
    console.log("Incoming request for", request.url);
    const body = await fetch("https://hello.deno.dev/").then((r) => r.text());
    const response = new Response(body, { statusCode: 200 });
    span.end();
    return response;
  });
});
  # Start Grafana. It will provide a web interface at localhost:3000
$ ./run-lgtm.sh
  # OTEL collector is now running on localhost:4318
$ export OTEL_EXPORTER_OTLP_ENDPOINT=localhost
  # It accepts http/json and http/protobuf.
$ export OTEL_EXPORTER_OTLP_PROTOCOL=http/protobuf
  # Let's give our app a nice name in telemetry data.
$ export OTEL_SERVICE_NAME=my-app
  # Deno needs the `--unstable-otel` flag.
$ deno run -A --unstable-otel my-app.js
  # Try making some requests to localhost:8000 and
  # exploring the Grafana dashboard.
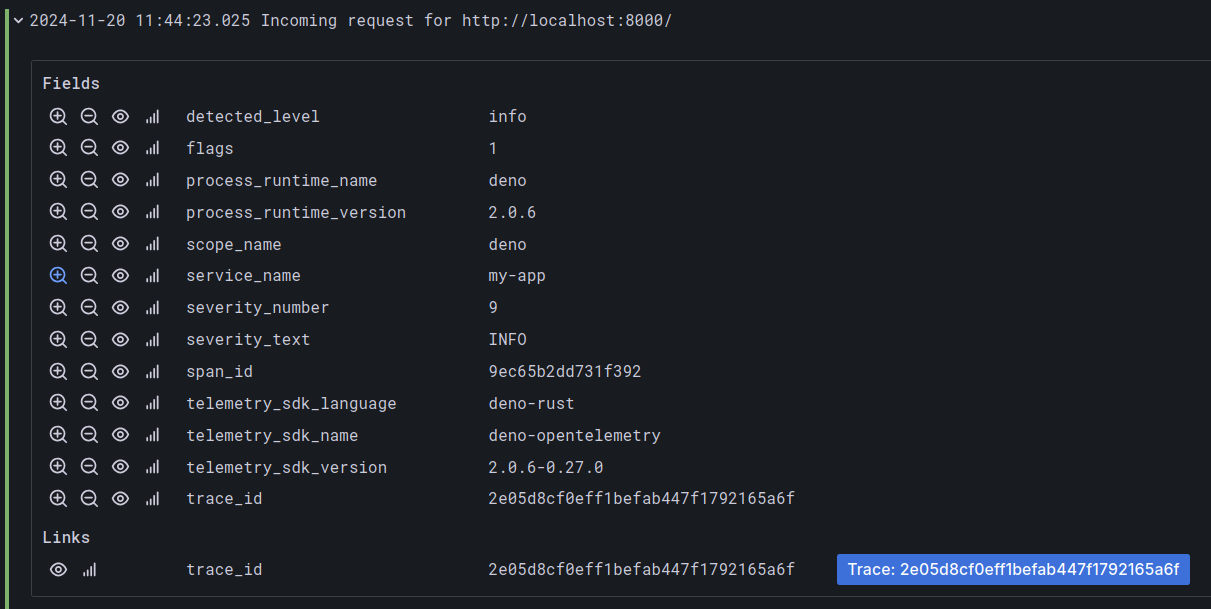
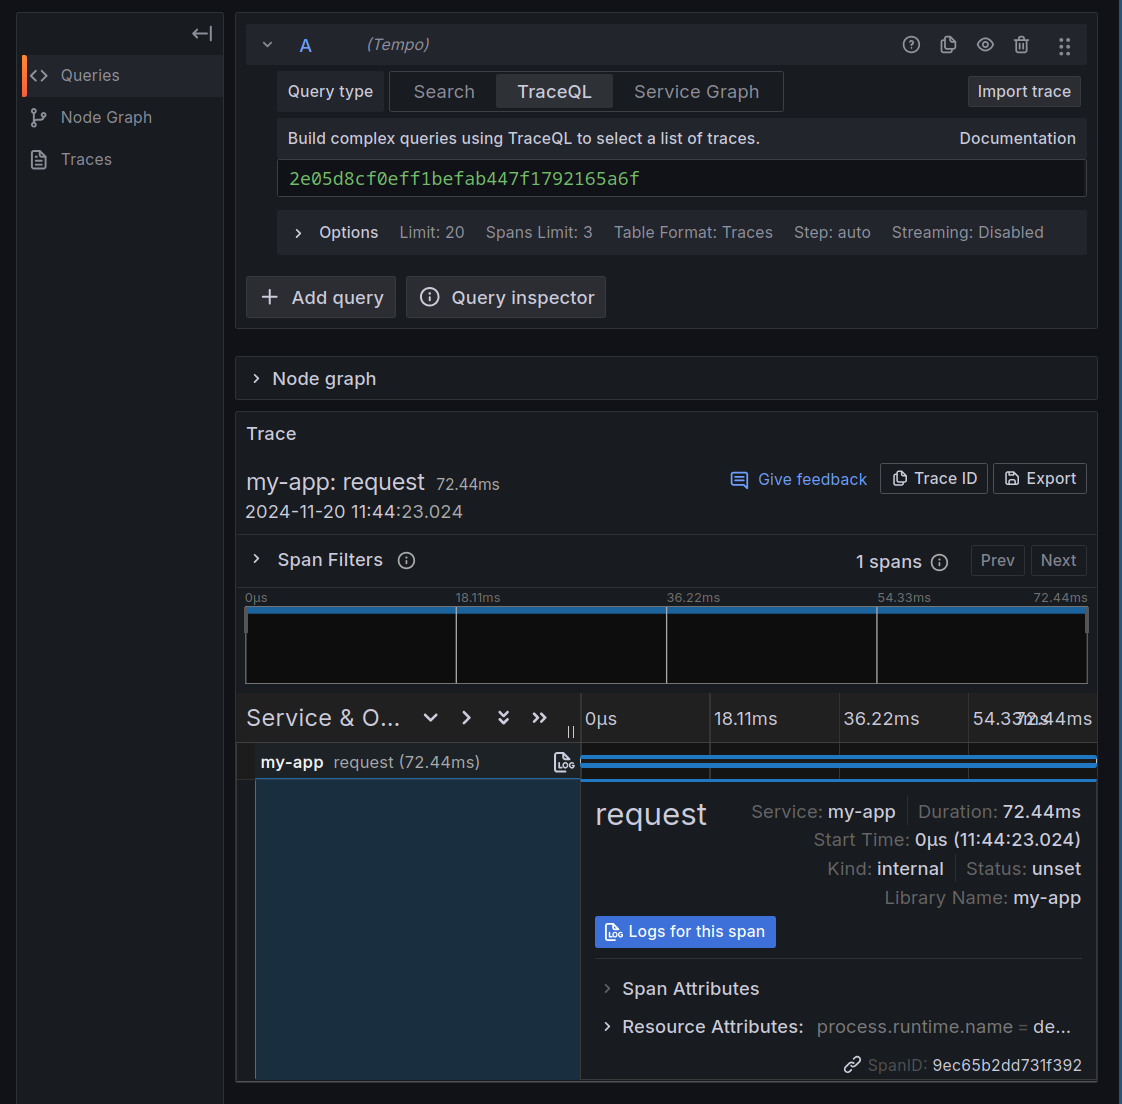
We can see logs and traces have been collected, and explore the data they contain:

